
Chart Echo
Chart Echo scans 450 million historical patterns to show you exactly how your current setup played out before.
Visit
About Chart Echo
Chart Echo is a revolutionary pattern-matching tool that transforms how traders and investors analyze the markets. Instead of relying on gut feelings or traditional indicators, Chart Echo taps into the market's own memory by searching roughly 450 million historical windows across stocks and crypto to find moments that look exactly like the chart you are watching right now. The core value proposition is simple: it shows you what happened next. By aggregating the continuations of historical matches, you get an honest, data-grounded picture of the odds, including how often setups rose, fell, or went nowhere, along with the average move and typical drawdown. This tool is built for active traders, long-term investors, and crypto watchers who want to study real precedent before making a decision. It is not a prediction or financial advice; it is the market's own memory organized so you can study precedent in seconds instead of scrolling through decades of charts by hand. With a clean, guided flow and no setup required, Chart Echo is priced for real people with a free tier that requires no signup.
Features of Chart Echo
Historical Pattern Matching
Chart Echo takes the exact shape of the chart you are currently viewing and searches across an enormous database of roughly 450 million historical windows to find moments that look most like it. Each match is ranked by similarity, and the tool shows you exactly why a particular historical pattern rhymes with your current setup. This feature turns subjective chart reading into a data-driven process, allowing you to see with clarity how the market has behaved in similar situations before.
Overlay and Outcome Statistics
Once a historical match is found, Chart Echo overlays that past pattern in gold directly onto your current chart. You can then see the outcome statistics for each match, including the average move, typical drawdown, and the probability of rising, falling, or going nowhere. This feature gives you a clear, visual representation of precedent, letting you study the days and weeks that followed each historical echo without having to manually scroll through old charts.
Guided Five Step Flow
The app walks you through a single, guided path from start to finish. You simply pick the stock or crypto you are watching, set the timeframe and pattern length, view the ranked list of historical echoes, overlay a match in gold to read the outcome statistics, and then act by saving the workspace, setting a reminder, or sharing a Story GIF. This eliminates guesswork and provides a repeatable, systematic approach to analyzing any chart setup.
Mobile Experience and Sharing
Chart Echo offers a fully guided mobile experience for checking setups away from your desk. You can easily save workspaces, set reminders for your favorite charts, and share high-quality GIFs and images with friends or your trading community. The tool also allows you to watch for new fractal projections and get notified when your favorite chart prints a strong pattern, ensuring you never miss a critical setup.
Use Cases of Chart Echo
Active Trading Setup Analysis
Before you take a trade, use Chart Echo to see the closest historical analogs to your current setup. The tool shows you how those similar patterns resolved over the following weeks, including the odds, average move, and typical drawdown. This allows you to make a more informed decision based on actual market precedent rather than emotion or speculation, giving you a significant edge in your trading strategy.
Long Term Investment Sanity Check
When you see a breakout or a sell off on a long term investment, use Chart Echo to sanity check that move against decades of historical precedent. Instead of relying on a single pundit's opinion, you can let the market's own history frame your decision. This use case is perfect for investors who want to confirm whether a current price action is truly unusual or if it fits a well established pattern from the past.
Crypto Pattern Recognition
Crypto markets are known for repeating patterns, and Chart Echo is built to handle them. You can match Bitcoin, Ethereum, and other major cryptocurrencies against their own past structure and across different assets to spot where today's price action has happened before. This is invaluable for crypto watchers who need to understand the typical outcomes of specific chart formations in a highly volatile market.
Educational Chart Study
For traders and investors looking to improve their chart reading skills, Chart Echo serves as an educational tool. By studying hundreds of historical matches and their outcomes, you can develop a deeper understanding of how patterns resolve over time. The tool provides a data grounded way to learn from the market's own memory, helping you build intuition and confidence in your analytical abilities.
Frequently Asked Questions
How does Chart Echo find historical matches?
Chart Echo uses a proprietary algorithm that takes the exact shape of your current chart and searches across roughly 450 million historical windows from stocks and crypto. It identifies moments where the price action looked most similar to your setup, ranks them by similarity, and then shows you how each match continued after the pattern. The process is automated and requires no configuration from you.
Is Chart Echo a prediction tool?
No, Chart Echo is not a prediction tool and it does not provide financial advice. It is a pattern matching and historical analysis tool that shows you what happened in the past when the market formed a similar chart pattern. The output is a statistical overview of outcomes based on real precedent, not a forecast of future price movements. You must use your own judgment when making trading or investment decisions.
Do I need to create an account to use Chart Echo?
No, you can try Chart Echo for free with no signup required. The free tier allows you to access the core pattern matching and outcome statistics features. If you want to save workspaces, set reminders, or unlock premium features like Pro Mode, intraday timeframes, alerts, and watermark free exports, you can create an account and choose a paid plan.
What assets are supported by Chart Echo?
Chart Echo supports a wide range of stocks and cryptocurrencies. The tool searches across roughly 450 million historical windows covering these asset classes. You can search for any popular stock ticker or cryptocurrency like Bitcoin and Ethereum. The platform is designed to work with major markets, and new assets are added regularly based on user demand and data availability.
Pricing of Chart Echo
Chart Echo offers a free tier that requires no account and no signup. This free access allows you to use the core pattern matching and outcome statistics features. For users who want more, creating an account unlocks saved workspaces. The Premium plan adds Pro Mode, saved setup reminders, intraday timeframes, alerts, and watermark free exports. Specific pricing details for the Premium plan are available on the Chart Echo website.
Similar to Chart Echo

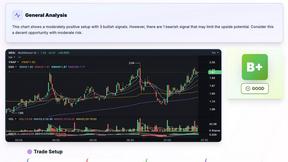
SnapPChart
SnappChart is an AI-powered trading chart analyzer that reviews your setup, grades its quality, and highlights key signals, risks, entries, stops.
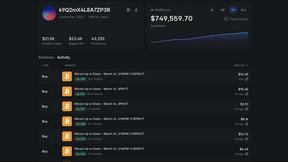
Polymarket Trading Bot For Crypto
Automate the proven 68-to-1.5M Polymarket arbitrage strategy on 5-15 minute crypto markets with full source code and live verification.
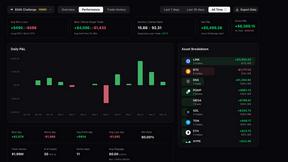
Trading Risk Lab
Take control of your trading with Trading Risk Lab's smart calculators for precise risk management and confident decision-making.
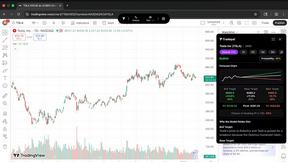
Tradepal
Tradepal transforms stock chart screenshots into actionable insights with AI-driven analysis and real-time forecasts.
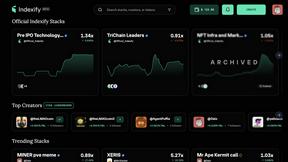
Indexify
Copy and own winning Solana crypto strategies from top traders with Indexify's transparent and secure platform.
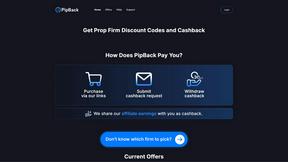
PipBack
Unlock unbeatable discounts and real cashback on every prop firm challenge you purchase with PipBack.