Dividend Data
Effortlessly access 30+ years of dividend data and financials for 80,000 stocks directly in Google Sheets or Excel with instant formulas.
Visit
About Dividend Data
Dividend Data is an innovative tool designed to simplify the way dividend and fundamental investors access stock market data. With over 30 years of comprehensive historical data for more than 80,000 tickers, Dividend Data integrates seamlessly into Google Sheets and Microsoft Excel, allowing users to access critical investment information without the hassle of API keys, coding, or manual data entry. The platform is tailored specifically for dividend investors, offering instant access to vital metrics such as dividends, yields, payout ratios, growth rates, financial statements, earnings, ratios, and price history. With a simple formula, investors can retrieve live data directly in their spreadsheets, making it easier than ever to make informed investment decisions. Built by a dividend investor for dividend investors, Dividend Data empowers users to harness institutional-grade data without the hefty price tag, ensuring that every investor can enhance their portfolio management strategies effectively.
Features of Dividend Data
Free Tier with Monthly Credits
Dividend Data offers a generous free tier that provides users with 2,500 credits each month. This means investors can explore and utilize the platform's extensive features without any trial limitations, making it accessible for everyone from novice investors to seasoned professionals.
Custom Functions for Dividend Investors
The platform includes 16 custom functions specifically designed to cater to all the needs of dividend investors. These functions allow users to pull detailed financial information and metrics effortlessly, ensuring that users have instant access to the data they require for effective stock analysis.
Extensive Historical Data
Dividend Data boasts over 30 years of historical stock market data, providing users with a rich context for their investment decisions. This extensive background allows investors to analyze trends, performance, and other critical metrics over a significant time frame, enhancing their overall market understanding.
Cross-Compatibility with Popular Spreadsheet Tools
Whether you prefer Google Sheets or Microsoft Excel, Dividend Data works flawlessly with both platforms. This cross-compatibility ensures that users can access crucial stock data in the environment they are most comfortable with, streamlining their investment analysis process.
Use Cases of Dividend Data
Streamlined Dividend Tracking
Investors can easily track dividends for multiple stocks by using Dividend Data's custom functions. By simply entering the appropriate formula, users can view upcoming dividends, yields, and payout ratios without sifting through multiple sources of information.
Comprehensive Financial Analysis
Dividend Data allows users to perform in-depth financial analyses by providing access to financial statements, earnings reports, and various financial ratios. This feature is invaluable for fundamental investors looking to evaluate a company's health before making investment decisions.
AI-Powered Research Assistance
With the AI Analyst feature, users can chat with an intelligent research assistant that provides insights and answers questions about investment strategies, stock performance, and market trends. This interactive tool enhances the research experience and helps investors make informed choices.
Automated Portfolio Management
By linking portfolios directly within Dividend Data, investors can track their dividends and overall portfolio performance in real time. This automation eliminates the need for manual tracking, enabling users to focus on strategy and decision-making instead of data entry.
Frequently Asked Questions
How does Dividend Data work?
Dividend Data integrates directly into your Google Sheets and Microsoft Excel, allowing you to access live stock market data simply by entering specific formulas. This makes data retrieval quick and easy.
Is there a cost associated with using Dividend Data?
Dividend Data offers a free tier with 2,500 monthly credits, allowing users to explore its features without any upfront costs. There are also paid plans available for more extensive use.
What types of data can I access through Dividend Data?
Users can access a wide range of data, including dividends, yields, payout ratios, financial statements, earnings, ratios, price history, and over 100 metrics relevant to dividend and fundamental investing.
Can I use Dividend Data on both Google Sheets and Microsoft Excel?
Yes, Dividend Data is designed to work seamlessly on both platforms, providing users with flexibility in how they analyze and manage their investment data.
Explore more in this category:
Similar to Dividend Data

Bullynx
Your AI copilot that reads any chart and answers market questions in seconds, free to start with no credit card.
Bank Statement Engine
Convert PDF bank statements to Excel, CSV, JSON, QBO, OFX, and QIF instantly with no signup or limits.
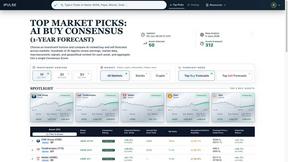
iPulse
iPulse gives you AI-powered market intelligence with real-time forecasts and risk signals trusted by thousands of traders worldwide.

TryBit
TryBit is the trusted crypto payment assistant helping merchants accept 40+ cryptocurrencies with 0.4% fees and instant volatility protection.

helpdol
Helpdol is the AI finance tool that 10,000+ freelancers use to track receipts, forecast cash flow, and manage taxes by voice.

Postservice.at
Secure your official, legally recognized Vienna business address with mail scanning from 49/month, trusted by over 1,000 clients.
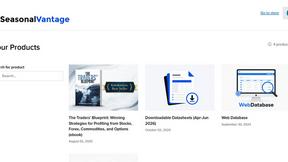
SeasonalVantage
SeasonalVantage gives traders the edge with 90%+ win-rate seasonal patterns and real-time options flow to spot smart money moves instantly.
Polymarket Trading Bot For Crypto
Automate the proven 68-to-1.5M Polymarket arbitrage strategy on 5-15 minute crypto markets with full source code and live verification.