Dividend Data vs Prediction Pulse
Side-by-side comparison to help you choose the right AI tool.
Dividend Data
Effortlessly access 30+ years of dividend data and financials for 80,000 stocks directly in Google Sheets or Excel with instant formulas.
Last updated: March 11, 2026
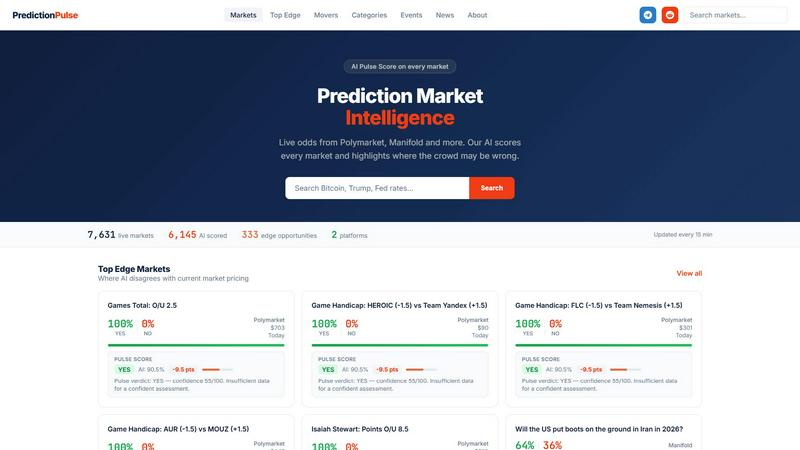
Prediction Pulse
Unlock market insights with Prediction Pulse, where AI analyzes trends and probabilities to reveal hidden opportunities in live markets.
Last updated: March 18, 2026
Visual Comparison
Dividend Data

Prediction Pulse
Feature Comparison
Dividend Data
Free Tier with Monthly Credits
Dividend Data offers a generous free tier that provides users with 2,500 credits each month. This means investors can explore and utilize the platform's extensive features without any trial limitations, making it accessible for everyone from novice investors to seasoned professionals.
Custom Functions for Dividend Investors
The platform includes 16 custom functions specifically designed to cater to all the needs of dividend investors. These functions allow users to pull detailed financial information and metrics effortlessly, ensuring that users have instant access to the data they require for effective stock analysis.
Extensive Historical Data
Dividend Data boasts over 30 years of historical stock market data, providing users with a rich context for their investment decisions. This extensive background allows investors to analyze trends, performance, and other critical metrics over a significant time frame, enhancing their overall market understanding.
Cross-Compatibility with Popular Spreadsheet Tools
Whether you prefer Google Sheets or Microsoft Excel, Dividend Data works flawlessly with both platforms. This cross-compatibility ensures that users can access crucial stock data in the environment they are most comfortable with, streamlining their investment analysis process.
Prediction Pulse
AI Pulse Score
The AI Pulse Score is a unique feature that scores every market based on real-time data and predictive analytics. This score highlights discrepancies where the market may not accurately reflect the consensus likelihood of an event, providing users with actionable insights and potential trading opportunities.
Market Aggregation
Prediction Pulse aggregates thousands of markets from various platforms, allowing users to examine a wide range of events in one place. This aggregation not only simplifies the research process but also helps users identify trends and patterns across different platforms, enhancing their trading strategies.
Event Intelligence
Event intelligence is at the core of Prediction Pulse. Users can explore detailed event pages that summarize market data, probabilities, and AI-generated news updates. This feature enables users to analyze the market sentiment surrounding specific events and understand the factors influencing outcomes.
Live Updates
With live odds sourced from platforms such as Polymarket and Manifold, Prediction Pulse ensures that users have access to the latest market information. With updates occurring every 15 minutes, users can make timely decisions based on the most current data available, crucial for successful trading.
Use Cases
Dividend Data
Streamlined Dividend Tracking
Investors can easily track dividends for multiple stocks by using Dividend Data's custom functions. By simply entering the appropriate formula, users can view upcoming dividends, yields, and payout ratios without sifting through multiple sources of information.
Comprehensive Financial Analysis
Dividend Data allows users to perform in-depth financial analyses by providing access to financial statements, earnings reports, and various financial ratios. This feature is invaluable for fundamental investors looking to evaluate a company's health before making investment decisions.
AI-Powered Research Assistance
With the AI Analyst feature, users can chat with an intelligent research assistant that provides insights and answers questions about investment strategies, stock performance, and market trends. This interactive tool enhances the research experience and helps investors make informed choices.
Automated Portfolio Management
By linking portfolios directly within Dividend Data, investors can track their dividends and overall portfolio performance in real time. This automation eliminates the need for manual tracking, enabling users to focus on strategy and decision-making instead of data entry.
Prediction Pulse
Traders Seeking to Maximize Profits
Traders can leverage Prediction Pulse to identify mispriced markets and capitalize on discrepancies. By utilizing the AI Pulse Score, traders can spot potential edge opportunities, increasing their chances of making profitable trades in the prediction market landscape.
Researchers Analyzing Market Trends
Researchers can utilize the comprehensive data provided by Prediction Pulse to study market behavior and trends. The platform's aggregation of diverse markets allows for a thorough analysis of how public sentiment can influence outcomes in various sectors, from politics to technology.
Enthusiasts Exploring Future Events
For curious observers and enthusiasts, Prediction Pulse serves as an engaging platform to explore predictions about future events. Users can delve into various topics, from political events to technological advancements, and gain insight into how collective forecasting works in real time.
Investors Monitoring Market Sentiment
Investors can use Prediction Pulse to gauge market sentiment on particular events affecting their portfolios. By monitoring the AI-generated news and market movements, they can make informed decisions about their investments based on collective predictions from the market.
Overview
About Dividend Data
Dividend Data is an innovative tool designed to simplify the way dividend and fundamental investors access stock market data. With over 30 years of comprehensive historical data for more than 80,000 tickers, Dividend Data integrates seamlessly into Google Sheets and Microsoft Excel, allowing users to access critical investment information without the hassle of API keys, coding, or manual data entry. The platform is tailored specifically for dividend investors, offering instant access to vital metrics such as dividends, yields, payout ratios, growth rates, financial statements, earnings, ratios, and price history. With a simple formula, investors can retrieve live data directly in their spreadsheets, making it easier than ever to make informed investment decisions. Built by a dividend investor for dividend investors, Dividend Data empowers users to harness institutional-grade data without the hefty price tag, ensuring that every investor can enhance their portfolio management strategies effectively.
About Prediction Pulse
Prediction Pulse is a cutting-edge AI-powered intelligence platform designed for prediction markets enthusiasts. By aggregating data from prominent platforms like Polymarket and Manifold, Prediction Pulse organizes countless markets into cohesive real-world events. Its proprietary Pulse Score probability engine employs advanced artificial intelligence to analyze these markets and estimate the most likely outcomes, shedding light on potential mispricings and offering insights into why certain events may resolve in specific ways. Whether you're a trader seeking an edge, a researcher delving into market trends, or simply a curious observer, Prediction Pulse provides a comprehensive understanding of what prediction markets indicate about future events. With the ability to track over 29,000 live markets and continuously updated insights, it empowers users to make informed decisions and stay ahead in the rapidly evolving world of prediction markets.
Frequently Asked Questions
Dividend Data FAQ
How does Dividend Data work?
Dividend Data integrates directly into your Google Sheets and Microsoft Excel, allowing you to access live stock market data simply by entering specific formulas. This makes data retrieval quick and easy.
Is there a cost associated with using Dividend Data?
Dividend Data offers a free tier with 2,500 monthly credits, allowing users to explore its features without any upfront costs. There are also paid plans available for more extensive use.
What types of data can I access through Dividend Data?
Users can access a wide range of data, including dividends, yields, payout ratios, financial statements, earnings, ratios, price history, and over 100 metrics relevant to dividend and fundamental investing.
Can I use Dividend Data on both Google Sheets and Microsoft Excel?
Yes, Dividend Data is designed to work seamlessly on both platforms, providing users with flexibility in how they analyze and manage their investment data.
Prediction Pulse FAQ
How does Prediction Pulse determine the Pulse Score?
The Pulse Score is calculated using an advanced AI algorithm that analyzes market data, historical trends, and real-time probabilities. It evaluates how the crowd's predictions align with statistical models to provide a reliable score for each market.
Can I use Prediction Pulse for free?
While the specifics about pricing and tiers are not detailed, Prediction Pulse typically offers different access levels. Users may have the option to explore a limited version for free while premium features might require a subscription.
How often are the market data updates?
Prediction Pulse updates its market data every 15 minutes. This ensures that users have access to the most current market odds and insights, allowing for timely decision-making in the fast-paced prediction market environment.
What types of events can I explore on Prediction Pulse?
Prediction Pulse covers a vast array of events, including political elections, economic forecasts, technological advancements, and social phenomena. Users can explore diverse markets that reflect the collective intelligence of the crowd regarding these future events.
Alternatives
Dividend Data Alternatives
Dividend Data is a powerful tool designed for investors looking to access comprehensive stock market information, particularly focusing on dividends and fundamental analysis. This product falls within the Business & Finance category and offers over 30 years of historical data for more than 80,000 tickers, all easily integrated into Google Sheets and Microsoft Excel. Users often seek alternatives to Dividend Data for various reasons, such as pricing, specific features, or compatibility with their preferred platforms. When choosing an alternative, it's essential to consider factors like data accuracy, ease of use, and the breadth of metrics offered to ensure it meets your investment needs. Finding the right alternative can significantly impact your investment strategy, so look for options that provide robust historical data, customizable functions, and a user-friendly interface. Additionally, consider the support and resources available, as well as any free tier options that allow you to test the product without commitment. Ultimately, the goal is to find a solution that aligns with your investment philosophy and enhances your decision-making process.
Prediction Pulse Alternatives
Prediction Pulse is an innovative AI-powered intelligence platform that operates within the prediction market category. By aggregating data from various platforms, it provides insights into market probabilities, trends, and potential outcomes, making it a go-to tool for traders, researchers, and curious minds alike. However, users often seek alternatives to Prediction Pulse for reasons such as pricing, specific feature sets, or the need for different platform capabilities that better align with their unique requirements. When searching for alternatives, it’s essential to consider what features are most important to you, such as market coverage, analytical tools, user interface, and pricing structures. The right alternative should not only meet your immediate needs but also offer scalability for future requirements, ensuring that you can continue to derive value as your interests or business evolve.