LoadTester
Join 2,000+ teams running instant HTTP load tests from browser or CI with live analytics and zero infrastructure.
Visit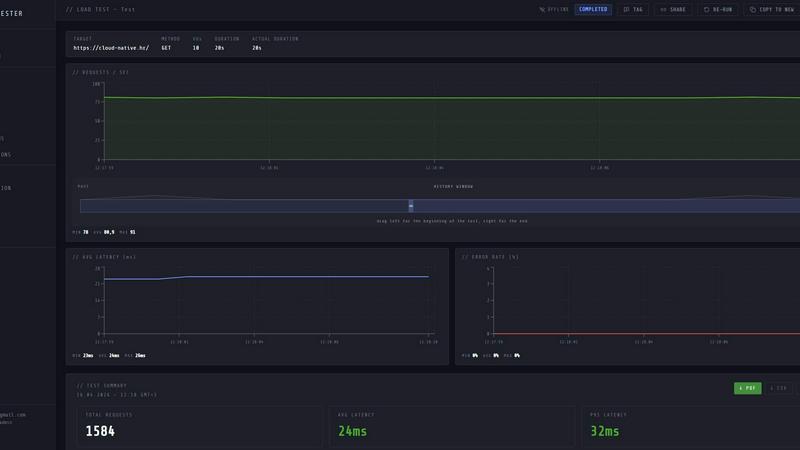
About LoadTester
LoadTester is a modern, cloud-native HTTP and API load testing tool that has been rapidly adopted by over 10,000 engineering teams worldwide. It is built by Cloud Native d.o.o. and designed to eliminate the single biggest headache in performance testing: infrastructure management. Forget about provisioning servers, configuring worker nodes, or setting up complex orchestration. LoadTester lets you run distributed load tests directly from your browser or your CI/CD pipeline in under 3 seconds. It is the go-to solution for developers, QA engineers, and platform teams who need repeatable, reliable performance checks without the operational overhead. The platform handles everything from worker scaling to live data streaming, allowing you to focus on what matters: catching performance regressions before your users do. With a maximum capacity of 10,000 virtual users (VUs) and 10,000 requests per second (RPS) per test, LoadTester is built for scale. It provides live analytics including p50, p95, and p99 latency, error rates, and throughput, all updating in real-time. Whether you are stress-testing a checkout endpoint, validating a new deployment, or establishing a performance baseline for your API, LoadTester delivers actionable insights with zero infrastructure to set up. Its viral appeal comes from its simplicity: create a test, hit run, and watch the data stream in. It is the tool that your team will actually use because it is fast, intuitive, and requires no training. With over 2.4 million requests processed in a single live run and a typical success rate of 99.8%, LoadTester has proven itself as a reliable backbone for performance engineering.
Features of LoadTester
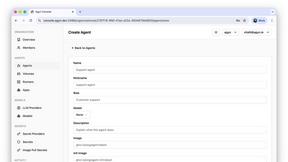
Instant Distributed Execution
Start a load test in under 3 seconds with zero infrastructure setup. LoadTester automatically dispatches and scales workers across its distributed network, handling all the underlying orchestration. You simply define your target URL, choose your mode (VUs or RPS), set the duration, and hit run. There is no queue time, no provisioning delays, and no scheduling headaches. Your team focuses on the results while LoadTester handles the execution flow, making it the fastest way to go from idea to data.
Live Streaming Analytics
Watch your test results unfold in real-time with a live dashboard that updates every second. You get instant visibility into throughput (RPS), latency percentiles (p50, p95, p99), error counts, and active virtual users. The latency distribution chart shows trends over the last 60 seconds, helping you spot bottlenecks as they happen. Unlike traditional tools that show you a report five minutes after the test ends, LoadTester gives you the story as it unfolds, enabling immediate reactions and on-the-fly adjustments.
Smart Auto-Stop and Thresholds
Set intelligent guardrails for your tests with custom thresholds that can automatically stop a run when things go wrong. You can define rules for p95 latency limits, error rate percentages, and regression comparisons against a baseline. When a threshold is breached, LoadTester can auto-stop the test, preventing wasted time and resources. It can also trigger webhooks, Slack notifications, or email alerts to inform your team immediately. This feature is a game-changer for CI/CD pipelines, ensuring that a failing test does not block the entire deployment process.
CI/CD Ready and Workflow Integrations
LoadTester is built to integrate seamlessly into your existing development workflow. It offers a full REST API for programmatic test creation and execution, webhooks for event-driven automation, and native integrations with Slack and email for alerting. You can schedule tests to run daily, hourly, or on every deploy, establishing a performance baseline that automatically catches regressions. The platform supports exporting results in PDF, CSV, or JSON formats, making it easy to share data with stakeholders or feed into your own monitoring systems.
Use Cases of LoadTester
Pre-Deployment Performance Validation
Before shipping a new feature or a major code change, engineering teams use LoadTester to run a quick performance check against the staging environment. By setting thresholds for p95 latency and error rates, they can automatically catch regressions that would otherwise degrade the user experience. A single failed threshold in the CI/CD pipeline can halt the deployment, giving developers immediate feedback without waiting for user complaints. This use case is critical for teams practicing continuous delivery and wanting to maintain high service level objectives (SLOs).
Capacity Planning and Spike Testing
When preparing for a major event, product launch, or seasonal traffic spike, teams need to know if their infrastructure can handle the load. LoadTester allows you to simulate a spike of up to 10,000 concurrent users or 10,000 RPS against a specific endpoint. By watching the live latency and error rate charts, you can identify the breaking point of your application and determine the necessary scaling requirements. The clear summary of total requests, average latency, and p95 data provides the exact numbers needed for capacity planning reports.
API Contract and Endpoint Benchmarking
For teams building or consuming APIs, establishing a performance baseline is essential. LoadTester enables you to run a scheduled test against a critical endpoint (e.g., /auth/me or /checkout) every day at a specific time. Over time, you build a historical record of performance metrics. The run-to-run comparison feature automatically highlights regressions, such as a p95 latency increase of more than 15%, and can trigger a Slack alert. This use case is perfect for platform teams that own shared APIs and need to guarantee performance for their internal customers.
Production Monitoring and Health Checks
Beyond pre-deployment testing, LoadTester is used to continuously monitor live production endpoints. By running a low-volume, scheduled test every few minutes, teams can verify that their services are responsive and meeting latency SLOs. The smart auto-stop feature ensures that if an endpoint starts failing or slowing down, the test stops immediately and alerts the on-call engineer. This provides a proactive monitoring layer that complements traditional APM tools, giving teams a synthetic user perspective on their application's health.
Frequently Asked Questions
How is LoadTester different from traditional load testing tools like JMeter or k6?
LoadTester eliminates the need to set up, configure, and manage any infrastructure. Traditional tools require you to provision servers, install agents, and orchestrate worker nodes. With LoadTester, you simply create a test in the browser or via API, and the platform handles all distributed execution, worker scaling, and data streaming. It is designed for teams that want to focus on results, not operations. Additionally, LoadTester provides real-time analytics and smart auto-stop features that are often cumbersome to configure in traditional tools.
Can I run LoadTester tests from my CI/CD pipeline?
Yes, absolutely. LoadTester is built for automation and integrates seamlessly with your CI/CD workflow. It provides a full REST API that allows you to create, launch, and monitor tests programmatically. You can set up webhooks to receive test completion notifications and configure thresholds that automatically fail a build if performance degrades. This makes it easy to add performance checks as a gate in your deployment pipeline, ensuring that only code that meets your performance standards gets shipped to production.
What kind of tests can I create with LoadTester?
You can create HTTP and API load tests for any endpoint that accepts GET, POST, PUT, or DELETE requests. You define the target URL, choose between Virtual Users (VUs) or Requests Per Second (RPS) mode, set the duration, and configure any custom headers or body payloads. LoadTester supports a maximum of 10,000 VUs or 10,000 RPS per test. You can also set multiple thresholds for latency, error rates, and regression against a baseline. The platform is ideal for testing REST APIs, microservices, and web applications.
How does LoadTester handle test data and results?
All test results are stored securely in your LoadTester project. During a live run, you can watch real-time analytics including throughput, latency percentiles, and error rates. After the test completes, you get a clean, summarized result page showing total requests, average latency, p95, p99, data sent, and data received. You can compare results across multiple runs to spot regressions. Results can be exported as PDF, CSV, or JSON for sharing with your team or integrating into external systems.
Similar to LoadTester
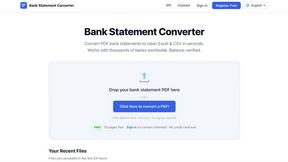
Bank Statement Engine
Free tool to convert PDF bank statements to Excel, CSV, JSON, QBO, OFX and QIF. No signup, no limits.
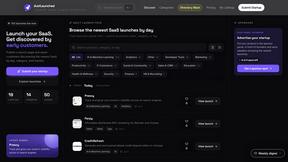
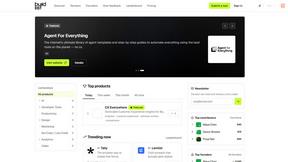
JustLaunched
The launch platform for indie makers — schedule your launch, get in front of buyers, and blast across directories.
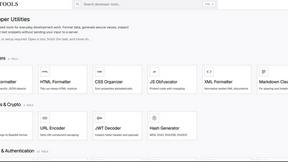
JavaScript Tools
JSTools.Space is a free collection of privacy-first developer utilities for formatting code, inspecting JSON and tokens, generating secure values, enc
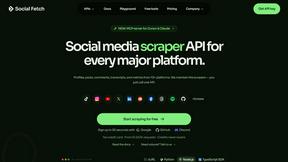
Social Fetch
AI social media API: scrape profiles, posts, search, and transcripts for agents. MCP server, SDK, OpenAPI—TikTok, Instagram, YouTube, 20+ platforms.