aVenture vs Dividend Data
Side-by-side comparison to help you choose the right AI tool.
Join 107,109+ companies using aVenture for AI-powered startup research and investment tracking.
Last updated: March 1, 2026
Dividend Data
Effortlessly access 30+ years of dividend data and financials for 80,000 stocks directly in Google Sheets or Excel with instant formulas.
Last updated: March 11, 2026
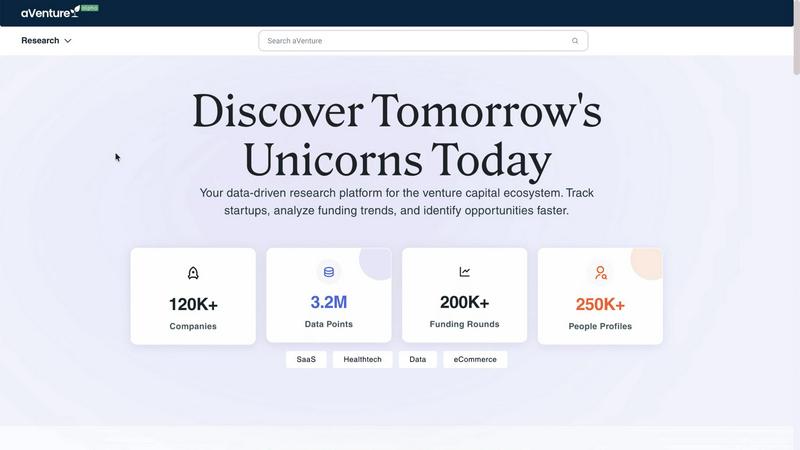
Visual Comparison
aVenture
Dividend Data

Feature Comparison
aVenture
Institutional-Grade Company Database
Dive into the world's most comprehensive venture capital dataset, featuring deep profiles on 107,109+ private companies across 132 countries. Track detailed ownership structures, complete funding histories, competitive landscapes, and key personnel moves with over 12.4 million meticulously curated data points sourced from 1,200+ channels. This is the same quality of data institutional investors rely on to spot winners and avoid pitfalls.
AI-Powered News Analyst
Transform overwhelming news noise into crystal-clear insight. Our proprietary AI doesn't just aggregate articles; it analyzes them. For every company, it automatically reviews the latest coverage to generate concise summaries of traction, identify emerging risks, and explain the real-world business impact of recent developments. Get the context behind the headline in seconds, not hours.
Advanced Funding & Market Analytics
Uncover emerging opportunities and trends with precision. Analyze over $12.7 trillion in funding activity across 211,033 people and 29,779 investors. Track deal flow, identify the most active VCs in specific sectors, and benchmark companies against their peers. Our platform surfaces the signals that matter, helping you predict which markets are heating up before they go mainstream.
Dynamic Research & Tracking Lists
Organize your market surveillance with powerful, customizable tracking tools. Create watchlists for competitors, investment themes, or specific technologies like SaaS, Healthtech, or Fintech. Receive alerts on funding rounds, leadership changes, and news for all tracked companies, ensuring you never miss a critical update in your ecosystem.
Dividend Data
Free Tier with Monthly Credits
Dividend Data offers a generous free tier that provides users with 2,500 credits each month. This means investors can explore and utilize the platform's extensive features without any trial limitations, making it accessible for everyone from novice investors to seasoned professionals.
Custom Functions for Dividend Investors
The platform includes 16 custom functions specifically designed to cater to all the needs of dividend investors. These functions allow users to pull detailed financial information and metrics effortlessly, ensuring that users have instant access to the data they require for effective stock analysis.
Extensive Historical Data
Dividend Data boasts over 30 years of historical stock market data, providing users with a rich context for their investment decisions. This extensive background allows investors to analyze trends, performance, and other critical metrics over a significant time frame, enhancing their overall market understanding.
Cross-Compatibility with Popular Spreadsheet Tools
Whether you prefer Google Sheets or Microsoft Excel, Dividend Data works flawlessly with both platforms. This cross-compatibility ensures that users can access crucial stock data in the environment they are most comfortable with, streamlining their investment analysis process.
Use Cases
aVenture
Founders Preparing for Fundraising
Arm yourself with data-driven confidence. Research comparable companies to benchmark your valuation, identify the most relevant active investors for your sector and stage, and understand current market sentiment. Use insights on competitor funding and traction to craft an irresistible narrative that resonates with VCs and accelerates your raise.
Investment Analysts Conducting Due Diligence
Go beyond the pitch deck. Perform deep, thorough due diligence by uncovering a target company's full cap table history, all known competitors, past and present investors, and real-time news sentiment from our AI analyst. Validate claims, assess market positioning, and identify potential risks with institutional-grade data, all in one platform.
Business Development & Sales Teams
Find your next perfect partner or enterprise customer. Scout for fast-growing startups in specific verticals, track their funding health and expansion plans, and identify key decision-makers. Use hiring trend data to pinpoint companies that are scaling and likely have new budget, giving your outbound efforts a massive, data-powered advantage.
Operators Monitoring the Competitive Landscape
Stay ten steps ahead of the competition. Set up tracking for all key rivals and adjacent players to get instant alerts on their new product launches, funding events, executive hires, and press coverage. Understand their strategy through our AI-curated news summaries, allowing you to make proactive strategic decisions to defend and grow your market share.
Dividend Data
Streamlined Dividend Tracking
Investors can easily track dividends for multiple stocks by using Dividend Data's custom functions. By simply entering the appropriate formula, users can view upcoming dividends, yields, and payout ratios without sifting through multiple sources of information.
Comprehensive Financial Analysis
Dividend Data allows users to perform in-depth financial analyses by providing access to financial statements, earnings reports, and various financial ratios. This feature is invaluable for fundamental investors looking to evaluate a company's health before making investment decisions.
AI-Powered Research Assistance
With the AI Analyst feature, users can chat with an intelligent research assistant that provides insights and answers questions about investment strategies, stock performance, and market trends. This interactive tool enhances the research experience and helps investors make informed choices.
Automated Portfolio Management
By linking portfolios directly within Dividend Data, investors can track their dividends and overall portfolio performance in real time. This automation eliminates the need for manual tracking, enabling users to focus on strategy and decision-making instead of data entry.
Overview
About aVenture
Stop guessing. Start knowing. aVenture is the institutional-grade intelligence platform that's revolutionizing how the smart money navigates the private markets. With a comprehensive database tracking over 107,109 active companies, $12.7 trillion in total funding, and 29,779 investors, it's the most powerful research tool built specifically for venture investing and private company analysis. Forget sifting through fragmented news and stale databases. aVenture delivers real-time, actionable insights on market positioning, funding stages, competitors, and hiring trends for over 100,000 startups. Its secret weapon? An AI Analyst that scours the latest news to instantly summarize company traction, flag potential red flags, and decode how recent events impact a business's future. Trusted by top-tier VCs, forward-thinking founders, and sharp operators, aVenture is the competitive edge for fundraising, due diligence, partnership scouting, and market surveillance. In a world where information is power, aVenture provides the precision intelligence that drives billion-dollar decisions.
About Dividend Data
Dividend Data is an innovative tool designed to simplify the way dividend and fundamental investors access stock market data. With over 30 years of comprehensive historical data for more than 80,000 tickers, Dividend Data integrates seamlessly into Google Sheets and Microsoft Excel, allowing users to access critical investment information without the hassle of API keys, coding, or manual data entry. The platform is tailored specifically for dividend investors, offering instant access to vital metrics such as dividends, yields, payout ratios, growth rates, financial statements, earnings, ratios, and price history. With a simple formula, investors can retrieve live data directly in their spreadsheets, making it easier than ever to make informed investment decisions. Built by a dividend investor for dividend investors, Dividend Data empowers users to harness institutional-grade data without the hefty price tag, ensuring that every investor can enhance their portfolio management strategies effectively.
Frequently Asked Questions
aVenture FAQ
What makes aVenture different from other startup databases?
aVenture is built with institutional rigor, combining the largest database of its kind with intelligent analysis. While others just list data, we provide context. Our AI Analyst digests news to give you summarized traction and risk reports, and our platform integrates funding, people, news, and market data into a single, actionable workflow trusted by professional investors.
How current and accurate is the data on aVenture?
Our data is continuously updated in real-time from over 1,200 sources, including regulatory filings, news publications, and direct sources. With 12.4 million+ data points and a dedicated data team, we maintain the high accuracy standards required for making critical investment and business decisions. The platform shows a live count of over 107,109 actively tracked companies.
Who is the typical user for aVenture?
aVenture is designed for professionals who need deep, reliable intelligence on private markets. Our user base includes Venture Capital and Private Equity investors, founders and startup executives, business development and sales leaders at large corporations, market research analysts, and investment bankers focused on technology and growth sectors.
Can I track specific industries or technologies?
Absolutely. aVenture offers powerful filtering and tagging by sector. You can easily research companies within popular tags like SaaS, Healthtech, Fintech, AI, Cleantech, and many more. You can create custom tracking lists to monitor specific verticals, technologies, or market trends, ensuring you only see the intelligence that matters to your goals.
Dividend Data FAQ
How does Dividend Data work?
Dividend Data integrates directly into your Google Sheets and Microsoft Excel, allowing you to access live stock market data simply by entering specific formulas. This makes data retrieval quick and easy.
Is there a cost associated with using Dividend Data?
Dividend Data offers a free tier with 2,500 monthly credits, allowing users to explore its features without any upfront costs. There are also paid plans available for more extensive use.
What types of data can I access through Dividend Data?
Users can access a wide range of data, including dividends, yields, payout ratios, financial statements, earnings, ratios, price history, and over 100 metrics relevant to dividend and fundamental investing.
Can I use Dividend Data on both Google Sheets and Microsoft Excel?
Yes, Dividend Data is designed to work seamlessly on both platforms, providing users with flexibility in how they analyze and manage their investment data.
Alternatives
aVenture Alternatives
aVenture is a powerful AI-driven business intelligence platform that helps professionals uncover startup insights, track investments, and analyze competitors. It’s become a go-to tool for founders, investors, and operators navigating the private markets. However, with so many users relying on it daily, the search for alternatives is hotter than ever. People explore other options for various reasons. Some need a different price point or a free tier to get started. Others might be looking for specific integrations, a different user interface, or a platform that better aligns with their team's unique workflow. The right fit depends heavily on your primary use case. When evaluating other tools, focus on what matters most for your goals. Key considerations include the depth and freshness of the startup database, the quality of AI-powered analysis, collaboration features for teams, and the ability to track real-time signals and news without getting overwhelmed. The best choice is the one that turns market noise into your competitive advantage.
Dividend Data Alternatives
Dividend Data is a powerful tool designed for investors looking to access comprehensive stock market information, particularly focusing on dividends and fundamental analysis. This product falls within the Business & Finance category and offers over 30 years of historical data for more than 80,000 tickers, all easily integrated into Google Sheets and Microsoft Excel. Users often seek alternatives to Dividend Data for various reasons, such as pricing, specific features, or compatibility with their preferred platforms. When choosing an alternative, it's essential to consider factors like data accuracy, ease of use, and the breadth of metrics offered to ensure it meets your investment needs. Finding the right alternative can significantly impact your investment strategy, so look for options that provide robust historical data, customizable functions, and a user-friendly interface. Additionally, consider the support and resources available, as well as any free tier options that allow you to test the product without commitment. Ultimately, the goal is to find a solution that aligns with your investment philosophy and enhances your decision-making process.